Phylogenetic analyses (step 4)#
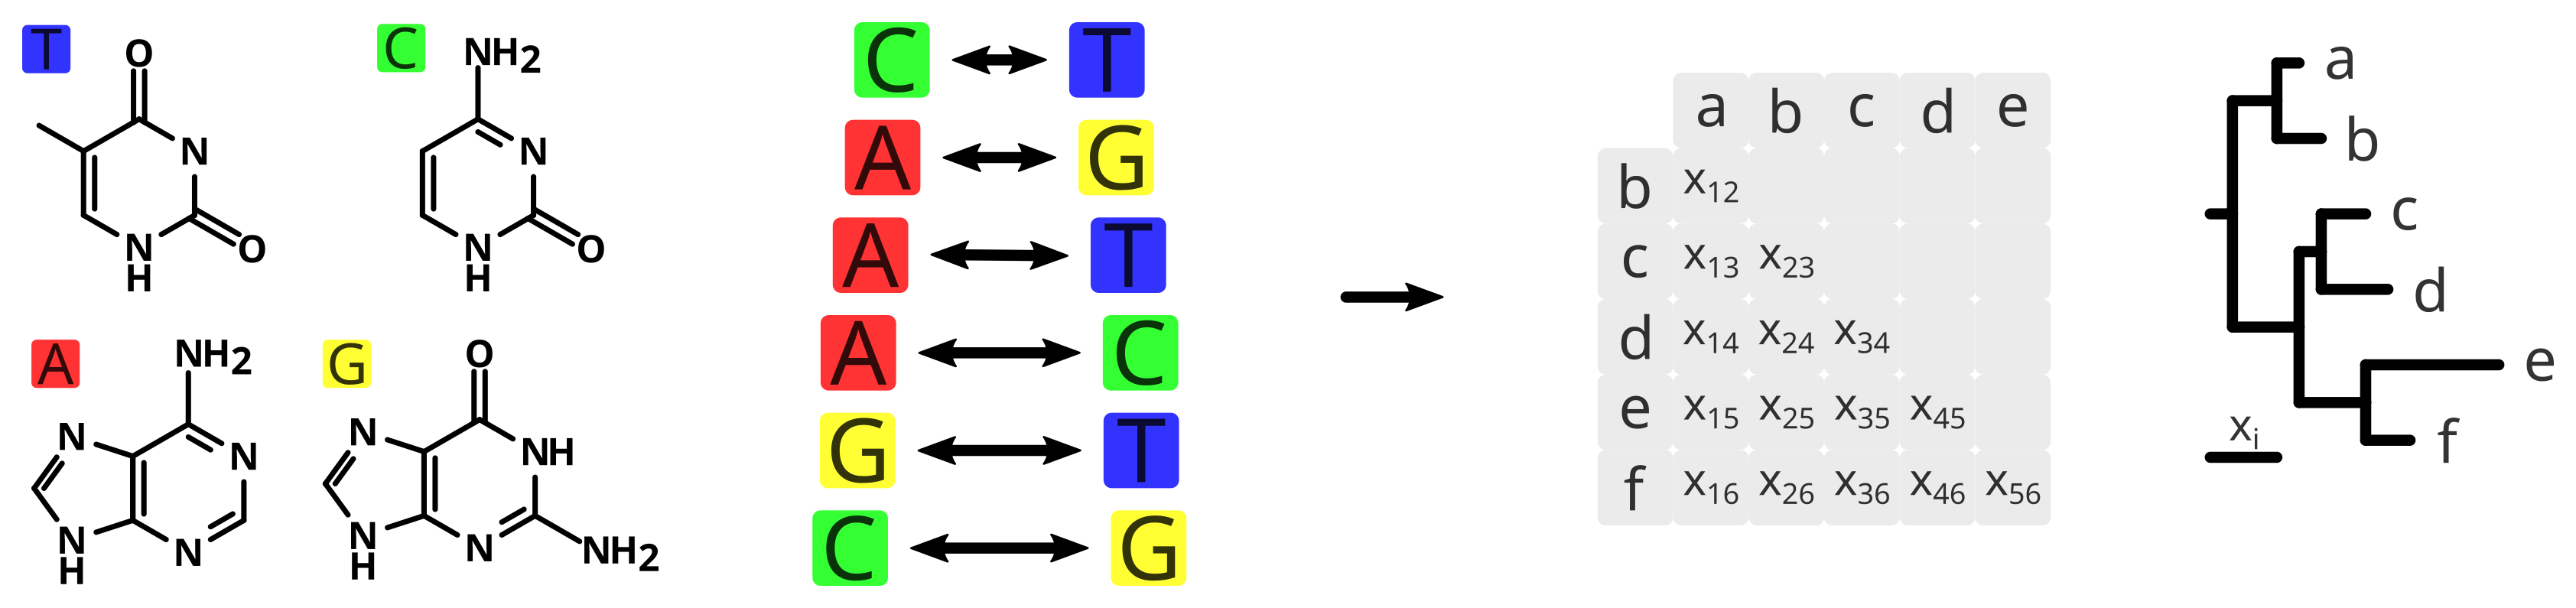
The alignment provides now a basis to measure differences/similarities among sequences. A pairwise comparison between group of species gives a first quick look of the alignment and the species themselves.
Yet, the phylogenetic relatedness is not directly link to the similarity or dissimilarity of the species, since not every difference of nucleotide has the same evolutionary consequence. Besides, some columns of the alignment will be prone to be more conservative and others to be more variable. Therefore the same nucleotide change may imply different weight depending on their position in the alignment. Different models of evolution assume different parameters resulting in different rates of evolution among the same sequences, and allows comparing not only species but also different columns of the alignment.
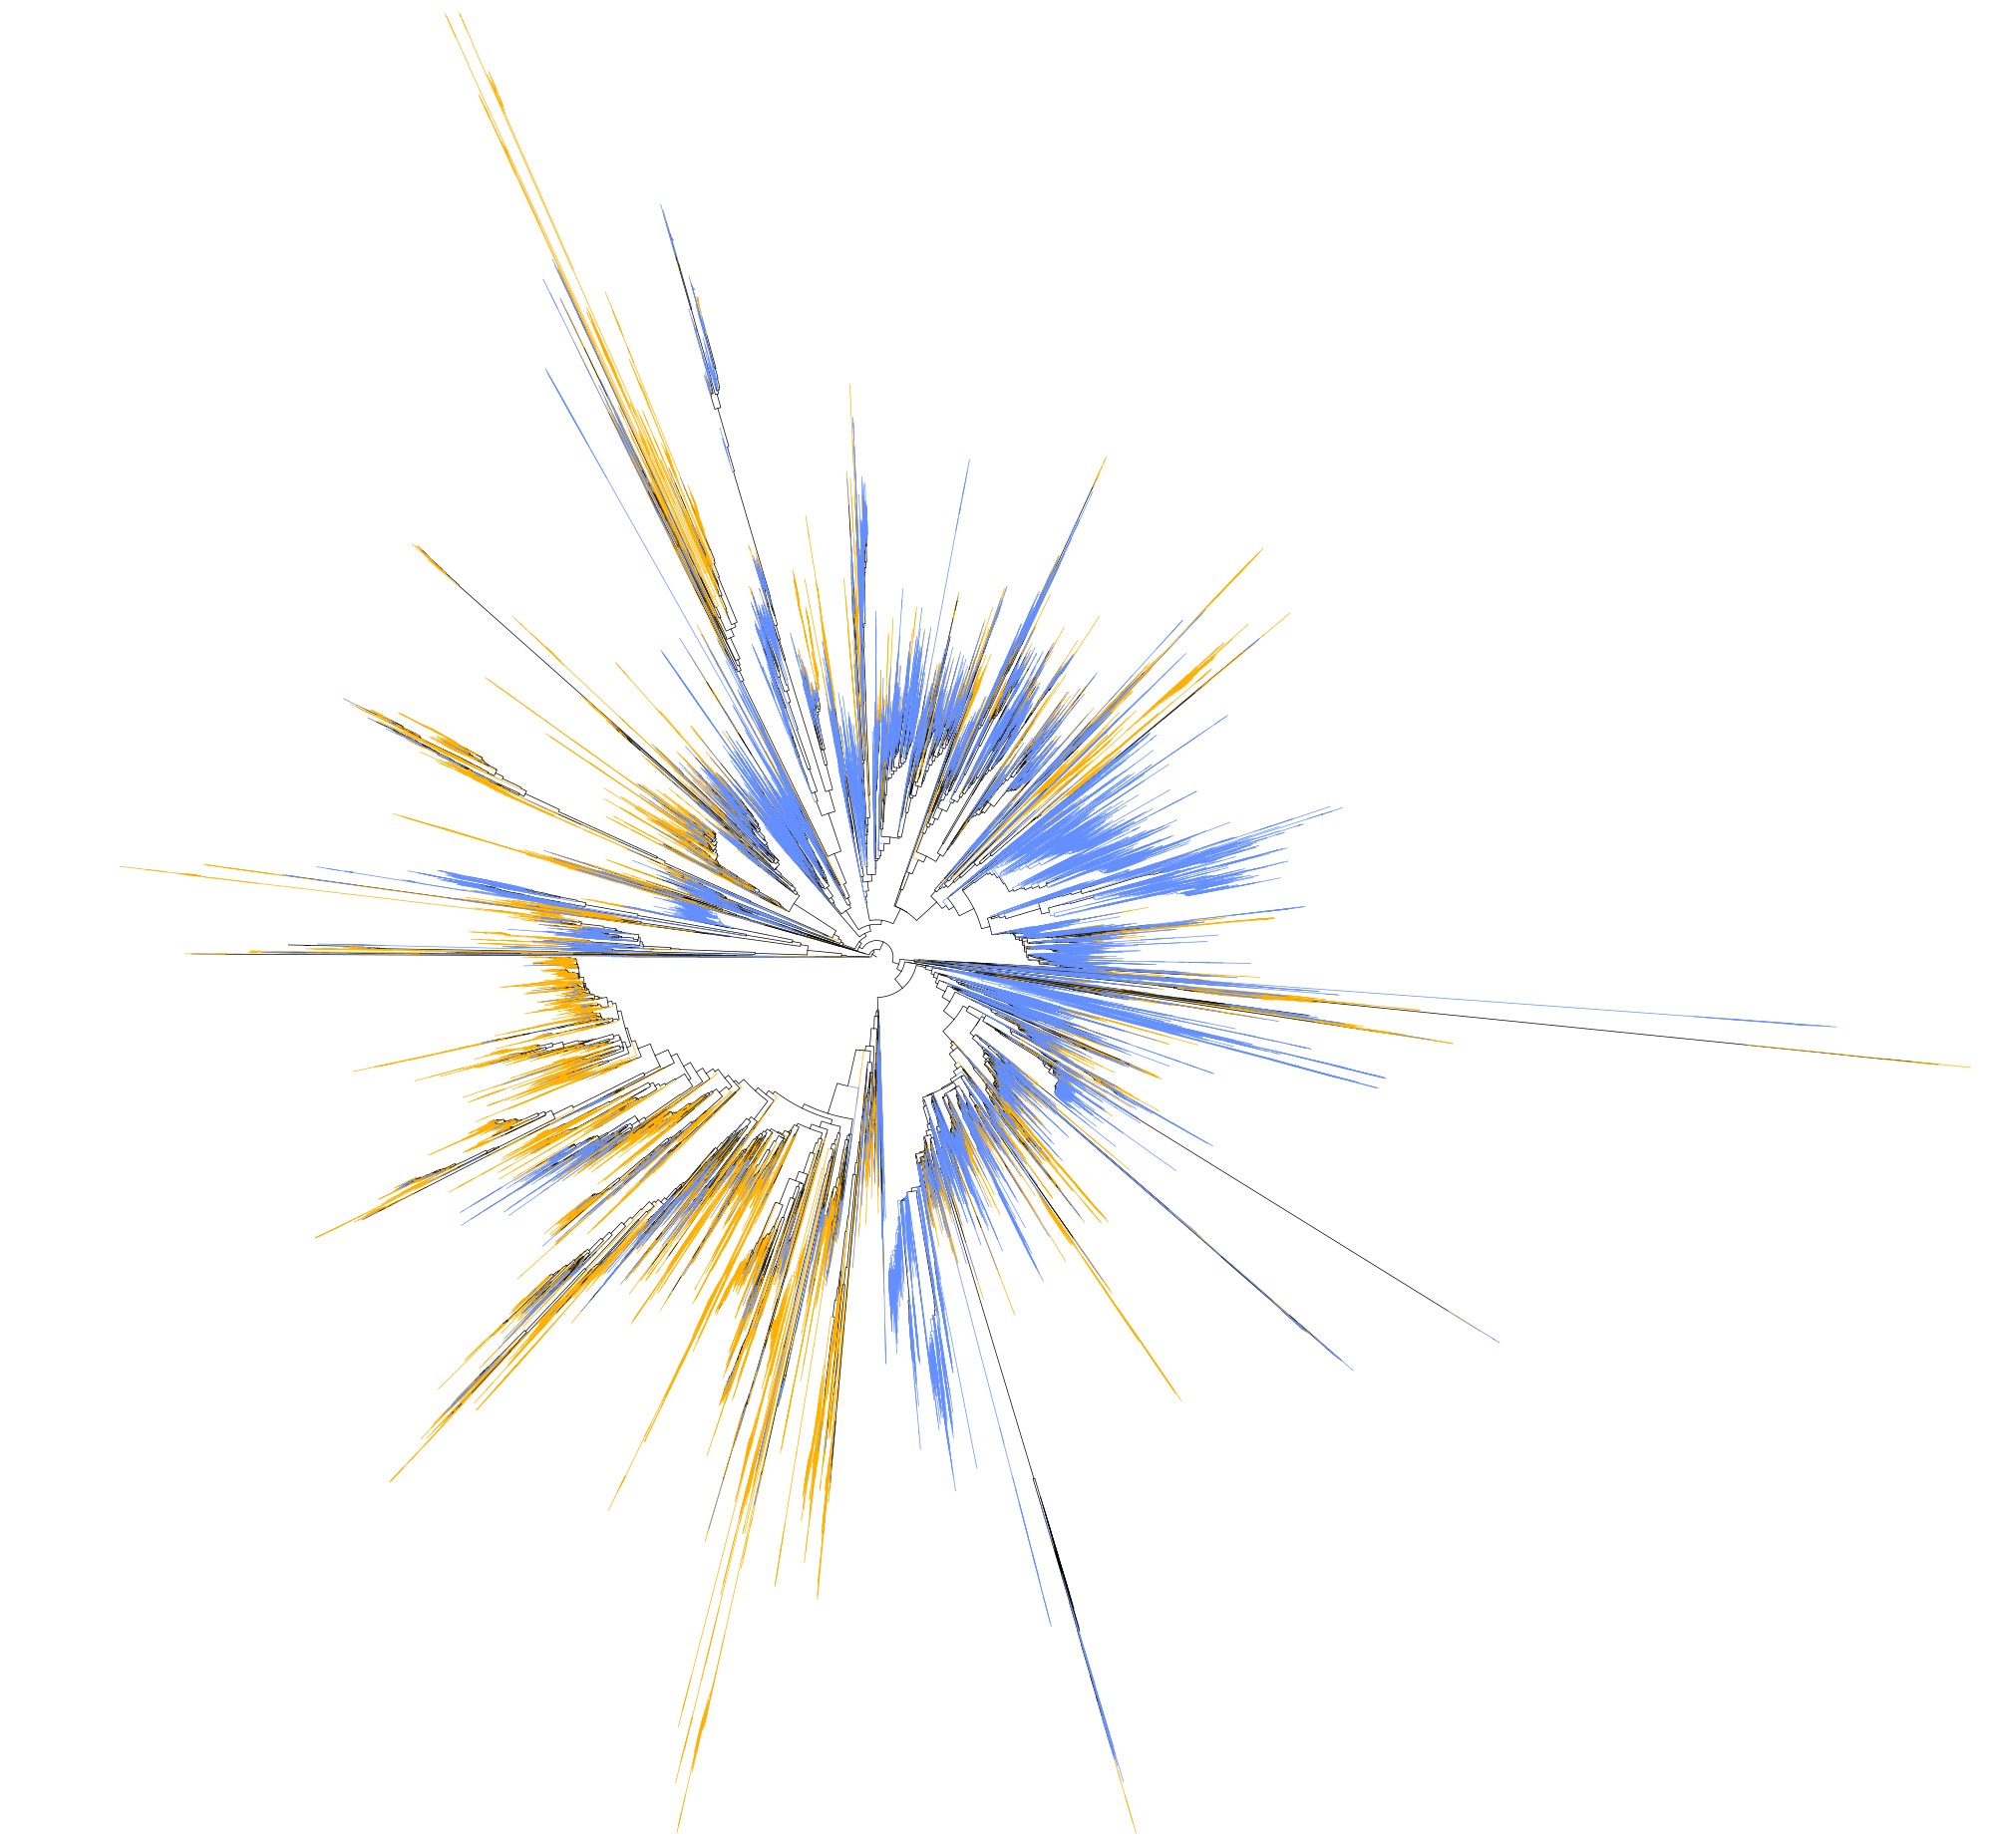
The simplest tree is a Neighbour Joining tree, where species are grouped together based on similarity, until there is no more species left. And the simplest model of evolution is the so-called Jukes-Cantor model (Jukes and Cantor, 1969) assuming equal base frequencies and equal mutation rates. In a slightly more complex model, Motoo Kimura included two more parameters for the different implications of transitions and transverions in the evolutionary rate (Kimura, 1980).
rapidnj $FILE > ${OUTPUT}_NJ.tre
More complex models of evolution rely on many assumptions and parameters that need to be estimated, adjusted and improved in order to better fit the given dataset. Such fit is normally measured by the likelihood (or more precisely the logarithmic of the likelihood) and in essence it tells you the probability to observe your data given the model. In the case of phylogenetic inference, we can translate this definition as how well your tree (or model and its parameters) explains your sequence alignment (or data). And to find the highest possible likelihood, several approaches have been proposed:
Maximum Likelihood
Bayesian Inference
Parsimony